Loading…
A data story · Nan Province, Thailand
Forest fires, PM2.5 haze, local livelihoods and public budgets are all connected. This story walks you through the evidence piece by piece until the whole system comes into view, along with the places where we can change it together.
About 12 minutes · 7 chapters · every figure sourced
Choose your path
The same evidence for everyone, with emphasis on what matters most to you and what you can actually do.
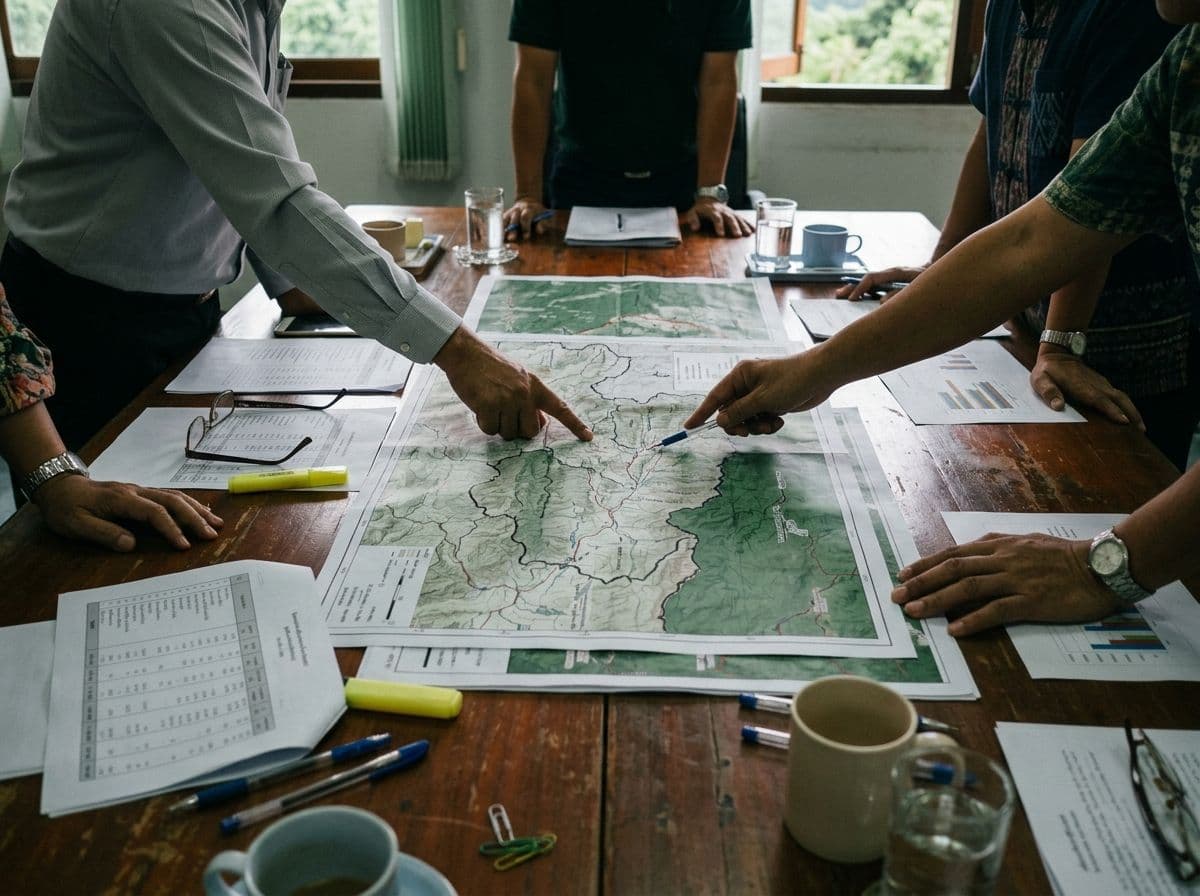 Decision-makersWhich policies and budgets actually reduce fire?Spatial evidence, the costs society pays, and where investing in community forests gives the best return.See the policy case
 Public & city residentsHow is the haze you breathe linked to forests in Nan?Follow the smoke from the mountains to the city, and find ways to back the people who protect the forest.See what you can do
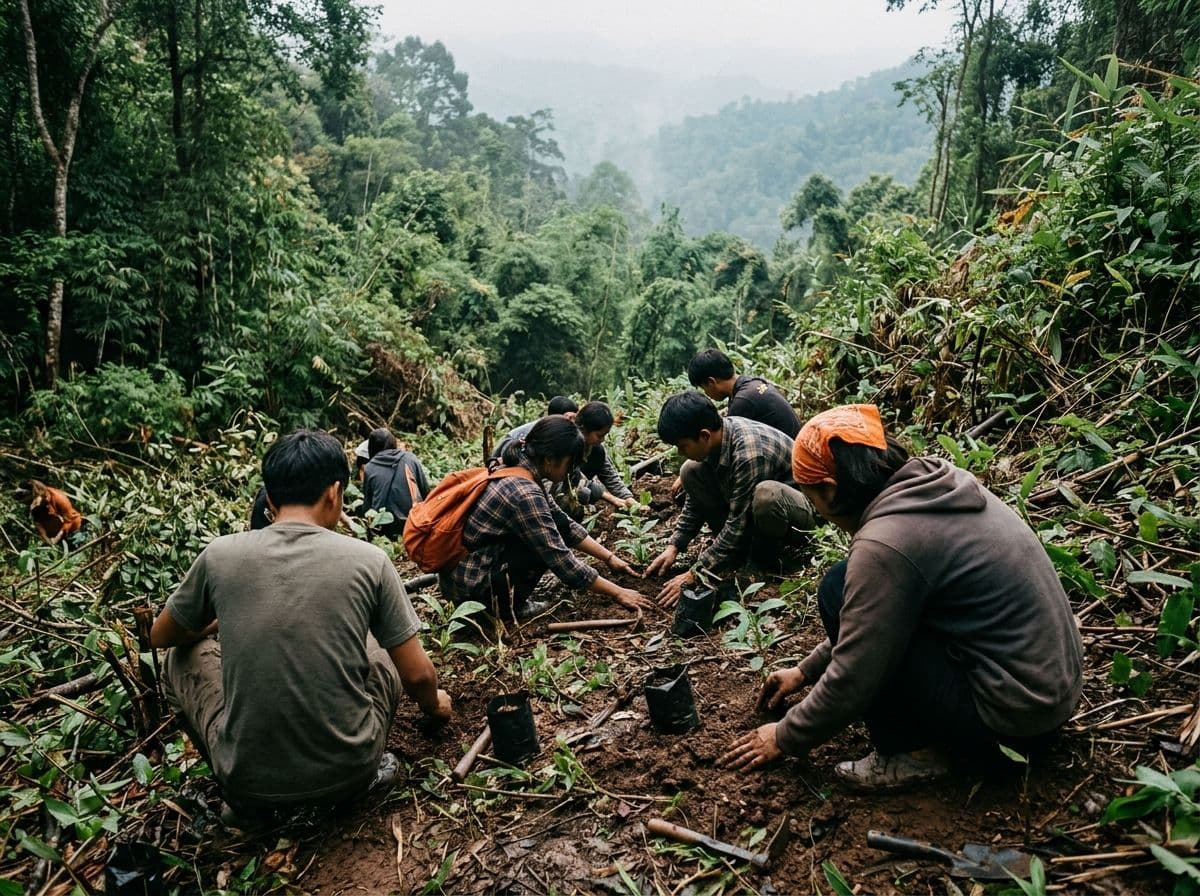 Communities & forest networksOur story, our data, our voiceLocal community forest and hotspot data, plus materials to take straight into conversations with agencies.See community tools
Chapter 02 · Fire season
From 11,366 in the 2023 fire season to 4,048 in 2025, a fall of about 64%. Hotspot counts also depend on each year’s weather, so Chapter 02 compares areas with and without community forests, with confidence intervals.[3]
Read the fire-season scrollytelling2026 counted to 17 Mar; season incomplete
The storyline
Each chapter opens one piece of evidence and shows how it connects to the rest. Read straight through, or jump to what interests you.
Read from chapter 1The whole system
Strong community forests mean fewer fires, less haze and better health. When policy and budgets reach communities, the loop turns in the right direction.
Open data · Verifiable
Download the datasets, read our methods and limitations, and see the data gaps we are still working to fill.